Data Visualization Tools
In data analysis and presentation, using the right tools can greatly enhance how insights are shared. “Data Visualization Tools” offers an overview of popular platforms that turn raw data into clear and engaging visuals. This section will review various tools, focusing on their main features, benefits, and best use cases to guide you in selecting the most suitable option for your data storytelling. Whether you’re an experienced analyst or new to the field, knowing these tools will help you make more effective, data-driven decisions.Spreadsheets
Spreadsheets like Microsoft Excel, Google Sheets, and Apple Numbers are widely-used tools for creating data visualizations. These platforms offer built-in features that allow users to generate various types of charts and graphs to visually represent data, making them accessible for both novices and professionals.Advantages of Using Spreadsheets for Data Visualization
- Accessibility and Ease of Use: Spreadsheets are user-friendly and familiar to many, making it easy to start creating visualizations without extensive training.
- Integration with Data Sources: They allow for seamless data import and export, and can connect to various data sources, enhancing their functionality.
- Collaboration and Sharing: Features like real-time collaboration in Google Sheets enable easy sharing and teamwork on data visualizations.
Disadvantages of Using Spreadsheets for Data Visualization
- Performance Issues: Spreadsheets can experience slowdowns or crashes when dealing with very large datasets, impacting their effectiveness for extensive data analysis.
- Limited Advanced Features: They offer fewer advanced features compared to specialized data visualization tools, which may limit complex analyses and customization.
- Basic Customization: While useful for creating standard charts, they may not provide the sophisticated or interactive visualizations required for more detailed presentations.
Data Visualization Using Programming Languages
Programming languages such as Python, R, and JavaScript offer powerful tools for creating custom data visualizations. These languages provide a high level of flexibility and control, allowing users to design tailored visualizations that precisely meet their needs. Python and R, in particular, benefit from a wide range of specialized packages that facilitate data visualization. For Python, libraries like Matplotlib, Seaborn, Plotly, and Altair offer diverse capabilities for crafting detailed and interactive graphics. Similarly, R provides robust packages such as ggplot2, which is renowned for its versatility in creating complex and aesthetically pleasing plots. JavaScript also plays a significant role in web-based visualizations, with libraries like D3.js enabling the development of dynamic and interactive charts. Utilizing these programming languages and their associated libraries allows for the creation of highly customized and sophisticated data visualizations, making them ideal for advanced analytical tasks and interactive data exploration.Creating Visualization in R and Python
R
In the R programming language, the most well-known packages for data visualization are ggplot2 and Plotly. However, in the following tutorial, the visualizations go beyond static plots; an animated plot is also created. The aim is to use this plot as content for our Instagram, making the animation to create more engaging content for our users.R Financial Data Visualization
A glimpse of usage of ggplot in R.
Python
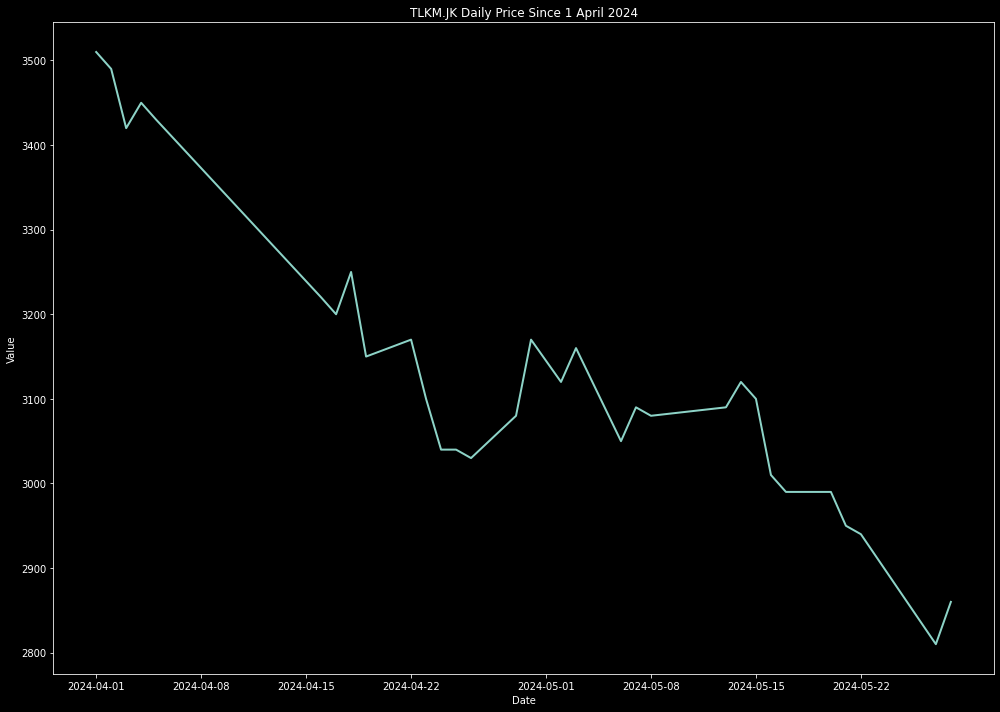
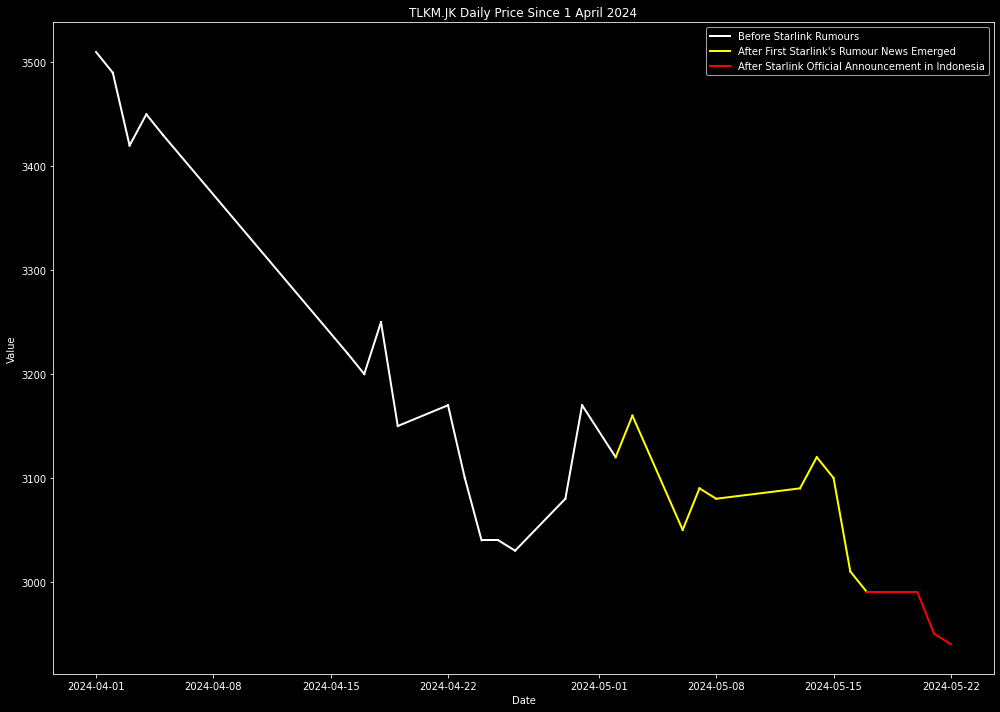
In Python there are several visualization packages, in this section, I’ll try to explain to you the packages that I usually used, which is Matplotlib. In the Data Analysis with Pandas section, all of you must already know about the pandas as how to gather data with API in Python. In this section, at first we need to gather the data using the API key that you’ve obtained from sectors.app. For a context, in this part we will analyze the price of TLKM.JK after Starlink announce their operation in Indonesia| symbol | date | close | volume | market_cap |
|---|---|---|---|---|
| TLKM.JK | 2024-04-01 | 3510 | 248116300 | 347708338470912 |
| TLKM.JK | 2024-04-02 | 3490 | 233071700 | 345727083479040 |
| TLKM.JK | 2024-04-03 | 3420 | 1502657000 | 338792724561920 |
| TLKM.JK | 2024-04-04 | 3450 | 205184000 | 348760504795136 |
| TLKM.JK | 2024-04-05 | 3460 | 116057100 | 339783352057856 |
Advantages of Using Programming Languages for Data Visualization
- Customization and Flexibility: Programming languages like Python, R, and JavaScript offer a high degree of customization, allowing users to create highly tailored visualizations that meet specific requirements.
- Advanced Features: Libraries such as Matplotlib, Seaborn, Plotly, ggplot2, and D3.js provide advanced features and capabilities, enabling complex and interactive visualizations that go beyond basic charting options.
- Integration with Data Analysis: These languages seamlessly integrate with data analysis workflows, allowing for sophisticated data manipulation and visualization in a unified environment.
Disadvantages of Using Programming Languages for Data Visualization
- Steeper Learning Curve: Programming languages require a certain level of expertise and familiarity, which can be challenging for users without a coding background.
- Development Time: Creating custom visualizations can be time-consuming, especially when developing complex or highly interactive graphics.
- Maintenance and Debugging: Code-based visualizations may require ongoing maintenance and debugging, which can be demanding and may require technical skills to resolve issues effectively.
Business Intelligence Tools
Business Intelligence (BI) tools like Tableau, PowerBI, Looker, and Qlik offer powerful solutions for data visualization and analysis. These tools are designed to simplify the process of creating interactive and insightful visualizations without extensive programming knowledge. They provide a range of pre-built templates, drag-and-drop interfaces, and integration capabilities that streamline the process of transforming raw data into actionable insights making them suitable for both individual analysis and collaborative decision-making.Advantages of Using BI Tools for Data Visualization
- User-Friendly Interfaces: BI tools offer intuitive drag-and-drop interfaces and pre-built templates that make it easy for users with varying levels of technical expertise to create effective visualizations.
- Integration and Connectivity: They integrate seamlessly with various data sources, including databases, spreadsheets, and cloud services, facilitating real-time data updates and comprehensive analysis.
- Interactive and Collaborative Features: BI tools provide interactive dashboards and collaboration features that allow users to explore data dynamically and share insights with team members effortlessly.
Disadvantages of Using BI Tools for Data Visualization
- Cost: Many BI tools come with significant licensing or subscription fees, which can be a barrier for smaller organizations or individuals.
- Limited Customization: While BI tools offer many pre-built options, they may not provide the same level of customization as programming languages for highly specialized or unique visualizations.
- Learning Curve: Although user-friendly, BI tools still require a learning curve to master their full range of features and functionalities, which may necessitate training or onboarding for effective use.
Introduction to Tableau
Overview of Tableau
Tableau is a premier Business Intelligence (BI) and data visualization tool widely recognized for its ability to transform raw data into meaningful insights. Founded in 2003 and later acquired by Salesforce, Tableau has grown to become a key player in the BI market. At the heart of Tableau’s appeal is its user-friendly interface, which allows even those with limited technical skills to create interactive and shareable dashboards. The software employs a simple drag-and-drop functionality that makes it easy to build a wide variety of visualizations, from basic charts and graphs to complex multi-dimensional views. One of Tableau’s standout features is its ability to connect to multiple data sources, ranging from traditional databases like SQL Server and Oracle to cloud-based sources such as Google Analytics and Salesforce. This versatility ensures that users can seamlessly integrate data from different platforms, providing a comprehensive view of their business landscape. Additionally, Tableau supports real-time data analysis, allowing users to monitor and respond to changes as they happen, which is crucial for dynamic and fast-paced environments. Tableau’s powerful visualization capabilities are complemented by its advanced analytics features. Users can perform sophisticated calculations, apply statistical models, and incorporate machine learning algorithms directly within the tool. These features enable deeper insights and more precise forecasting, helping organizations to make informed decisions based on robust data analysis. Collaboration is another key strength of Tableau. The tool allows for easy sharing of dashboards and visualizations within teams and across organizations. Users can publish their work to Tableau Server or Tableau Online, enabling colleagues to interact with the data and derive their own insights. This collaborative approach ensures that everyone in the organization can benefit from shared data insights, fostering a unified and informed decision-making process. Moreover, Tableau offers extensive customization options. Users can tailor dashboards to fit their specific needs, adjusting layouts, colors, and styles to create visually appealing and effective presentations. This customization capability ensures that visualizations are not only functional but also aligned with the organization’s branding and communication standards.Different Types of Tableau
Tableau offers several products tailored to meet the diverse needs of users, from individuals to large organizations. Each type of Tableau product has unique features and capabilities designed to facilitate data visualization, analysis, and sharing. 1. Tableau Desktop Tableau Desktop is a powerful data visualization tool designed for individual use. It allows users to connect to various data sources, create detailed visualizations, and develop interactive dashboards.- Features:
- Connects to multiple data sources, including databases, spreadsheets, and cloud services.
- Provides advanced analytics and visualization capabilities.
- Offers extensive customization options for creating detailed and tailored visualizations.
- Allows users to create and publish dashboards to Tableau Server or Tableau Online for sharing.
- Features:
- Facilitates centralized data management and collaboration.
- Allows users to interact with dashboards and reports via a web browser.
- Provides robust security and governance features to control access and permissions.
- Supports real-time data connectivity and automatic data refresh.
- Features:
- Provides the same collaboration and sharing capabilities as Tableau Server.
- Simplifies setup and maintenance with a cloud-based infrastructure.
- Allows users to access dashboards and reports from anywhere with an internet connection.
- Offers scalability to accommodate growing data needs without additional hardware investments.
- Features:
- Offers a free platform for creating and sharing visualizations with the public.
- Visualizations are hosted on Tableau’s public server and accessible to anyone.
- Ideal for journalists, bloggers, and anyone interested in sharing data insights publicly.
- Limited to public data only, with no option for private data storage or sharing.
- Features:
- Provides a visual interface for data cleaning and transformation.
- Supports data blending from multiple sources.
- Allows users to create repeatable data preparation workflows.
- Integrates seamlessly with Tableau Desktop for analysis and visualization.
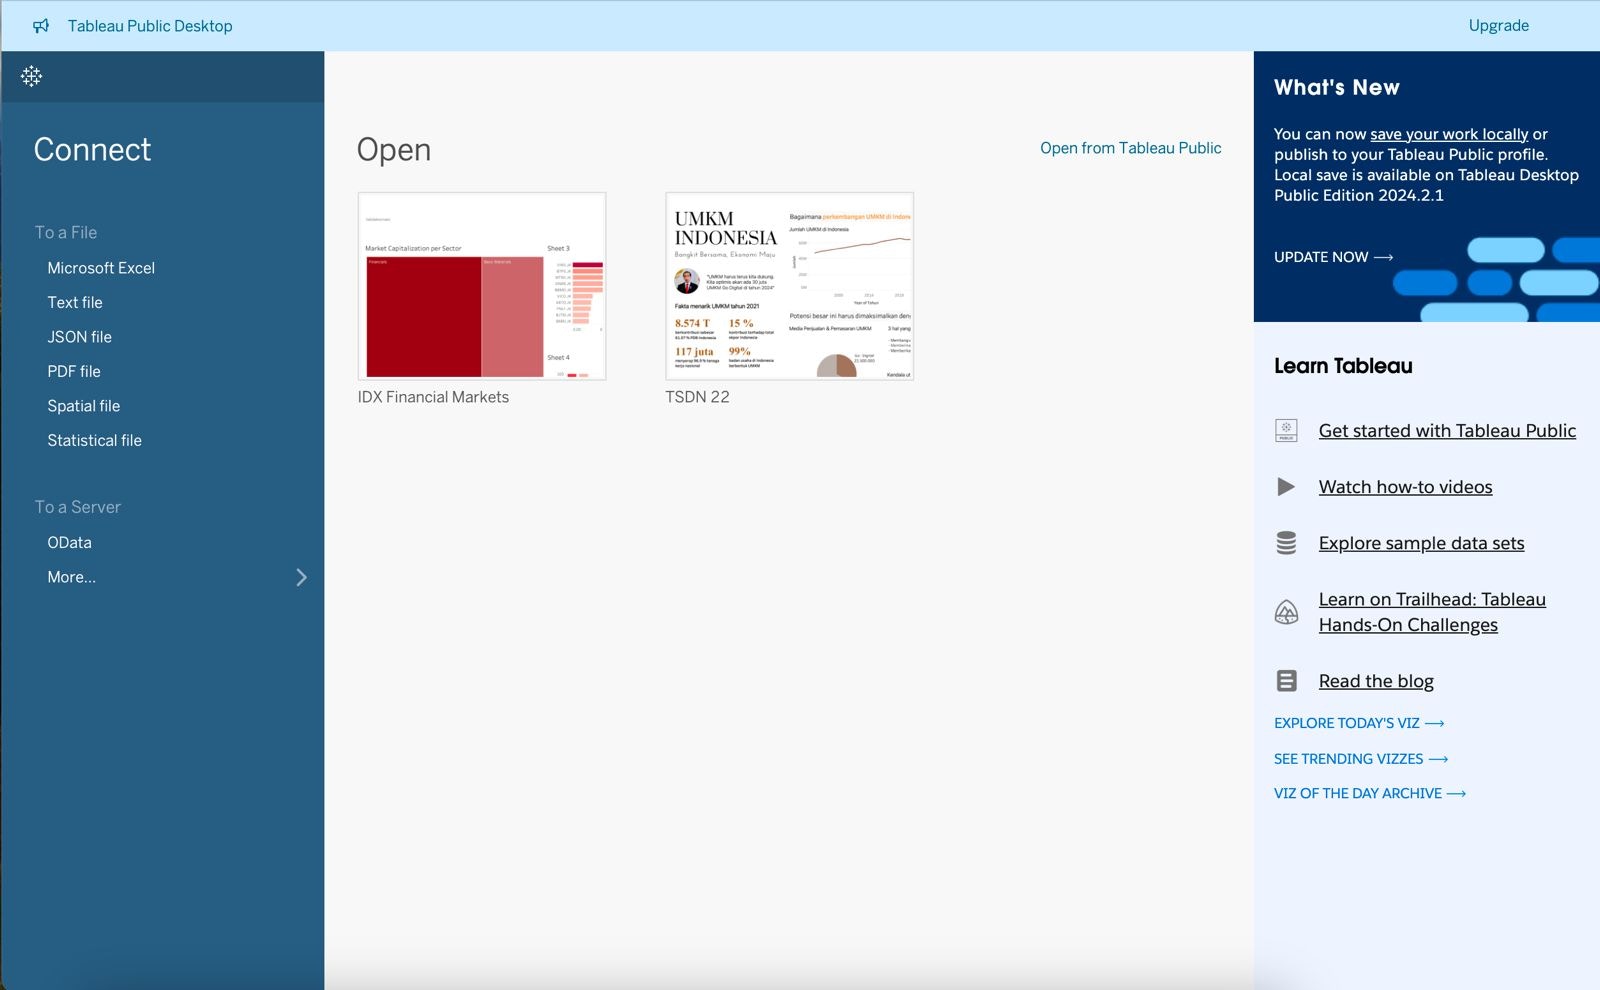
Creating First Visualization in Tableau Public
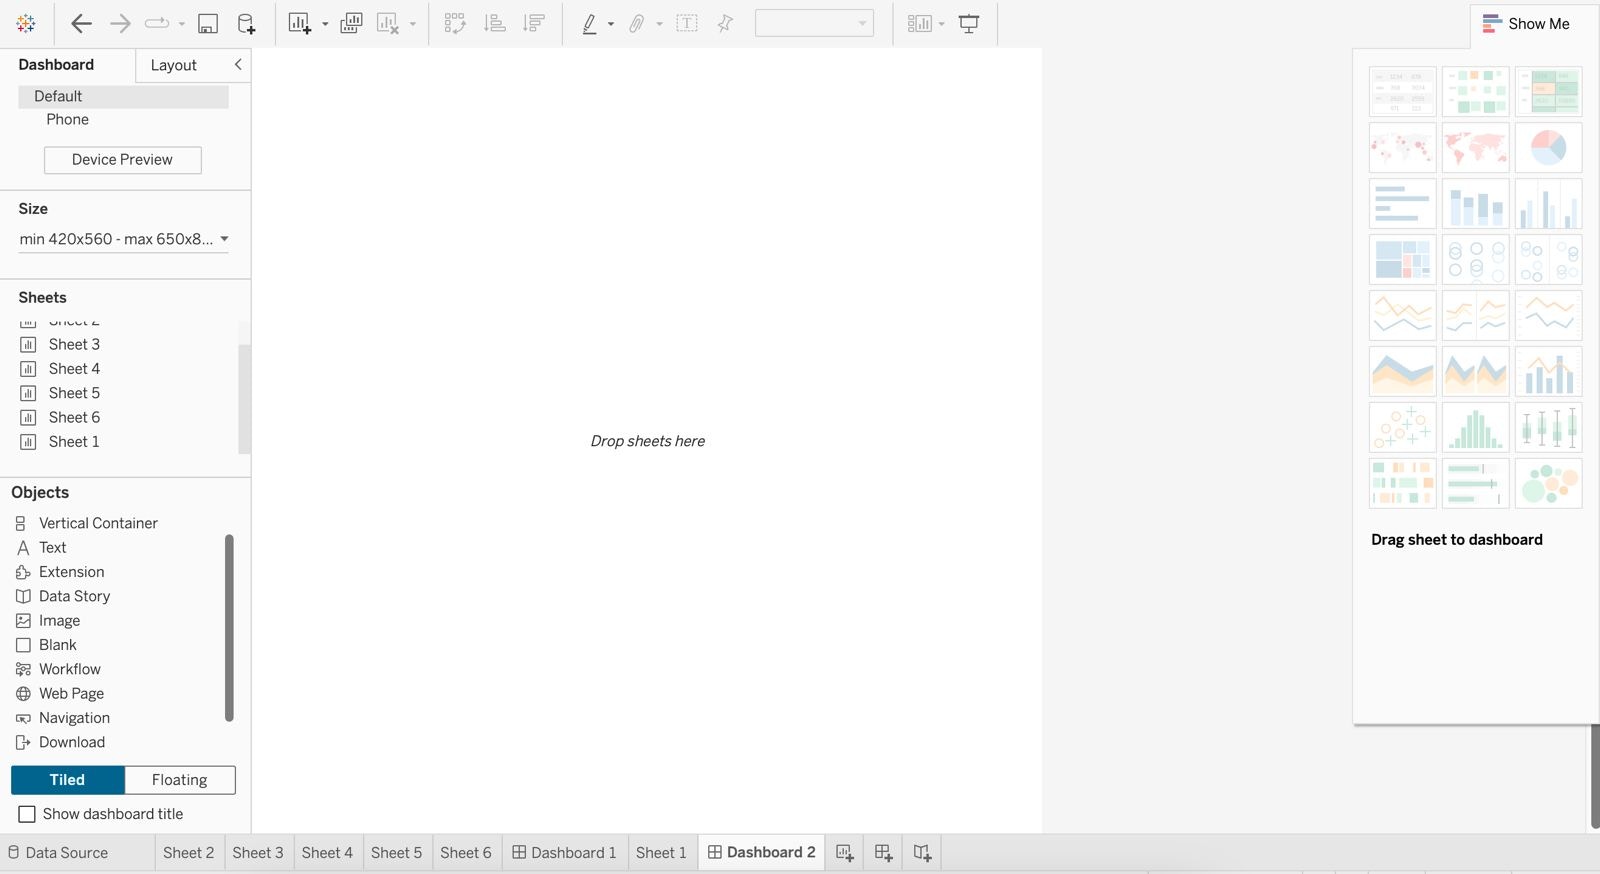
Before diving into exploring Tableau and its data visualization capabilities, it’s important to familiarize ourselves with some key terms to better understand the platform. In Tableau, two crucial terms are Worksheets and Dashboards. Unlike Looker Studio or PowerBI, Tableau doesn’t allow direct creation of visualizations on the dashboard canvas. Instead, you must first create individual visualizations in Worksheets and then combine multiple Worksheets into a Dashboard. The table below summarizes the differences between Worksheets and Dashboards.| Worksheets | Dashboards | ||
|---|---|---|---|
| Definition | A Tableau worksheet is a single view that contains one type of visualization, such as a chart or graph. | A Tableau dashboard is a collection of multiple worksheets and elements combined into one view. | |
| Features | - Single Visualization: Shows one chart or graph. | - Multiple Visualizations: Displays several charts or graphs together. | |
| - Customization: Allows you to adjust colors, labels, and axes. | - Interactivity: Links visualizations with filters and actions. | ||
| - Interaction: Includes features like filtering and tooltips. | - Layout Options: Arranges visualizations and elements for better presentation. | ||
| Use Case | Used to create individual visualizations for specific data analysis. | Used to provide an overall view and interactive exploration of data, ideal for presentations and reports. |
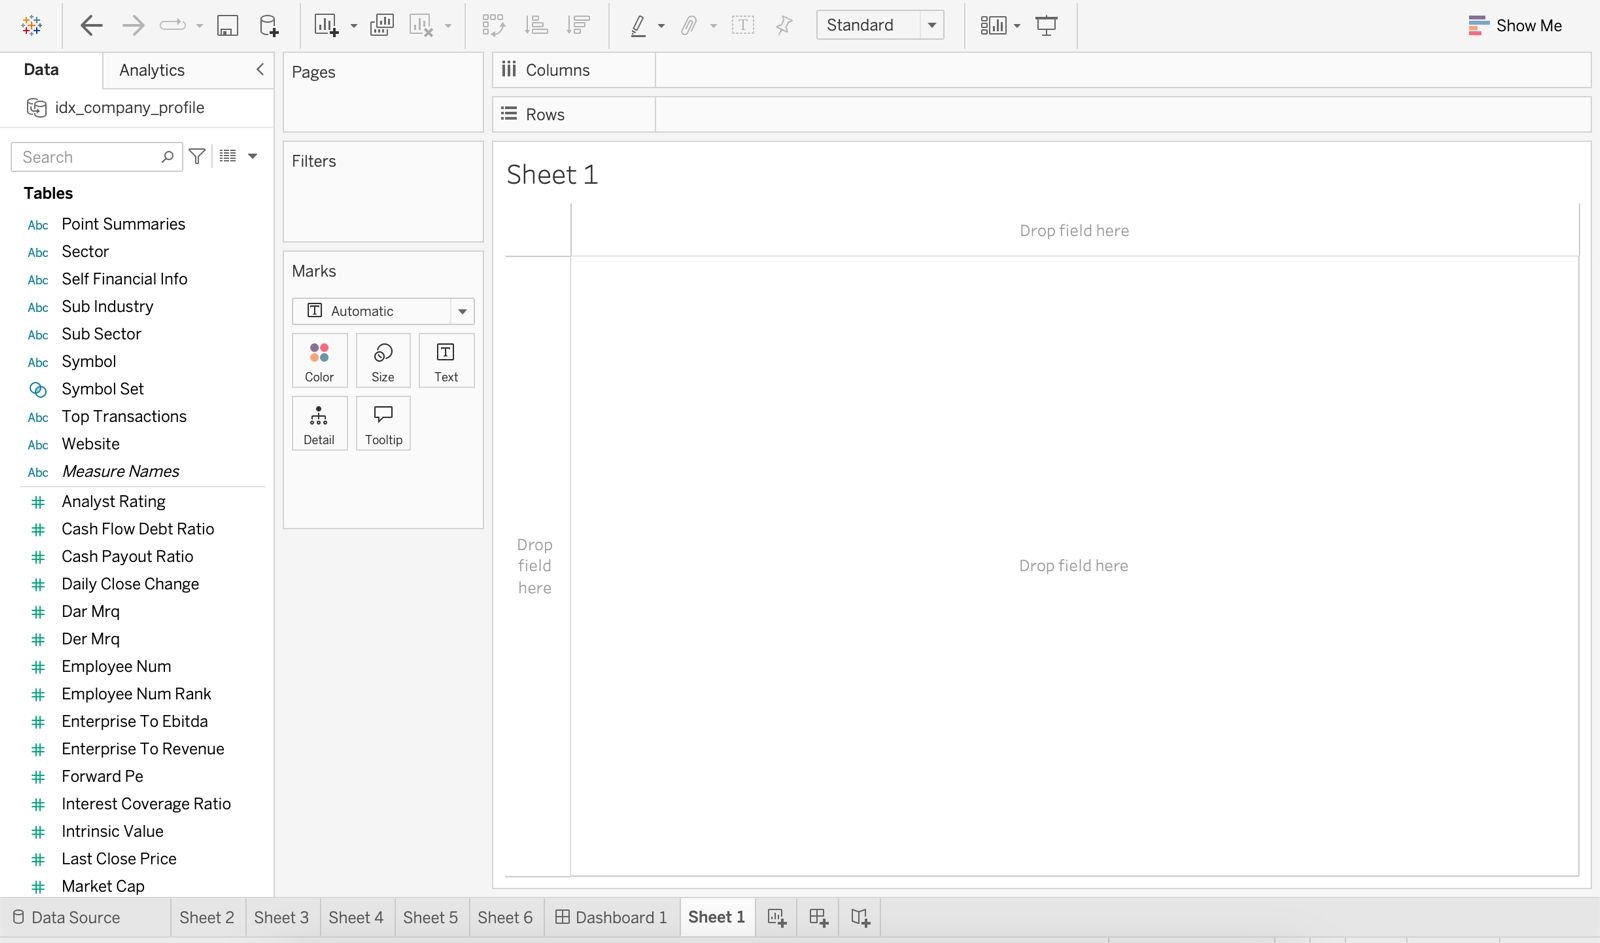
Importing Data
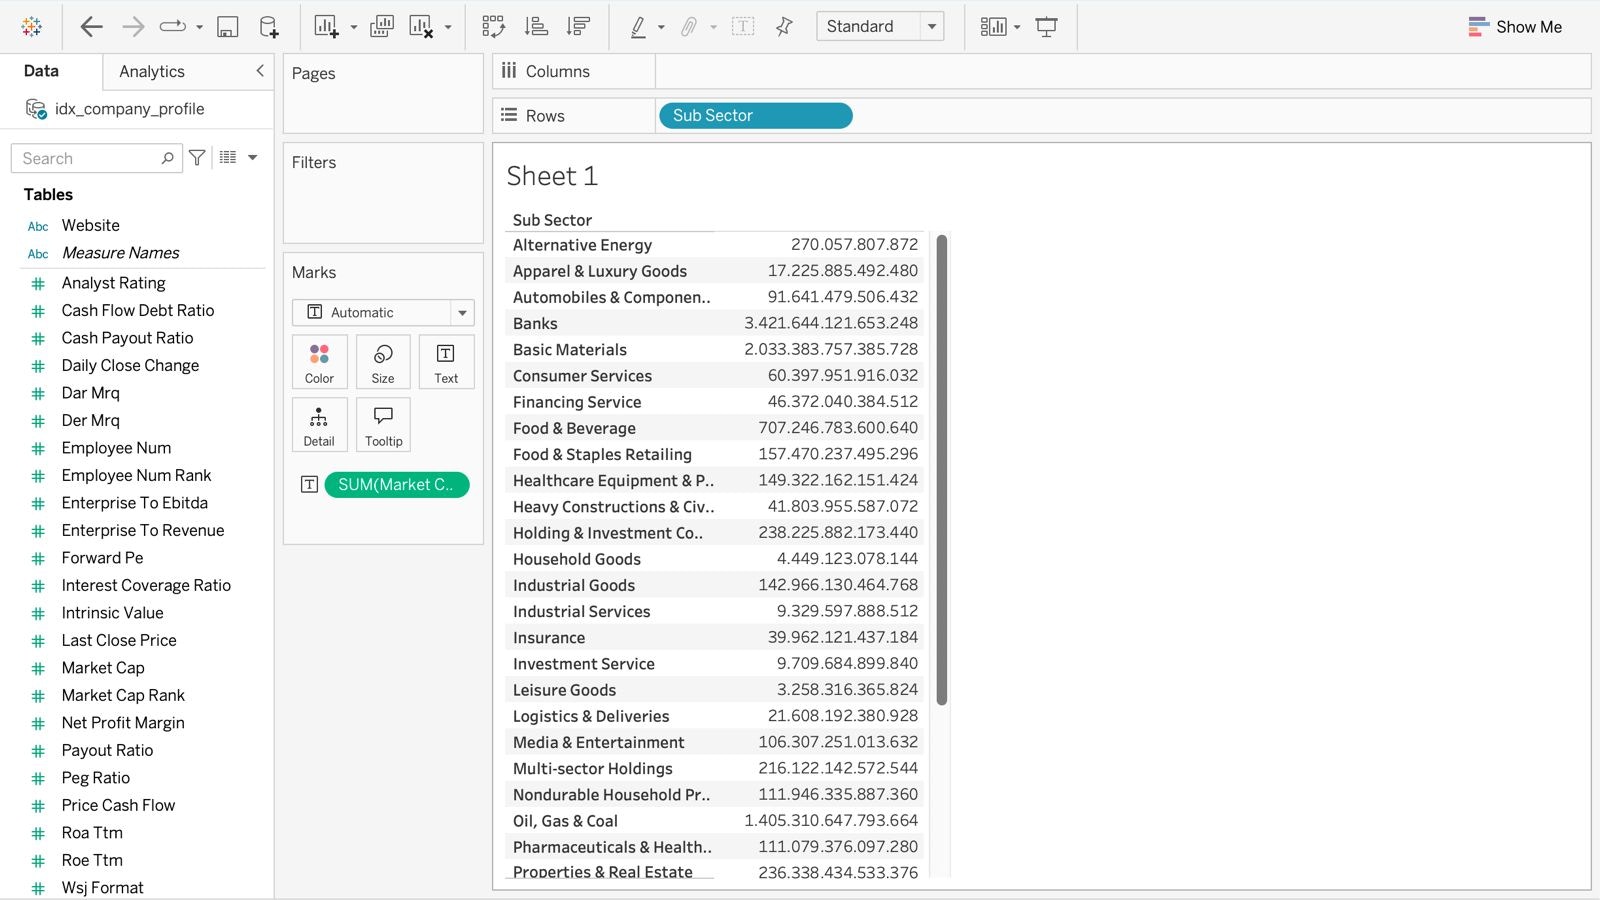
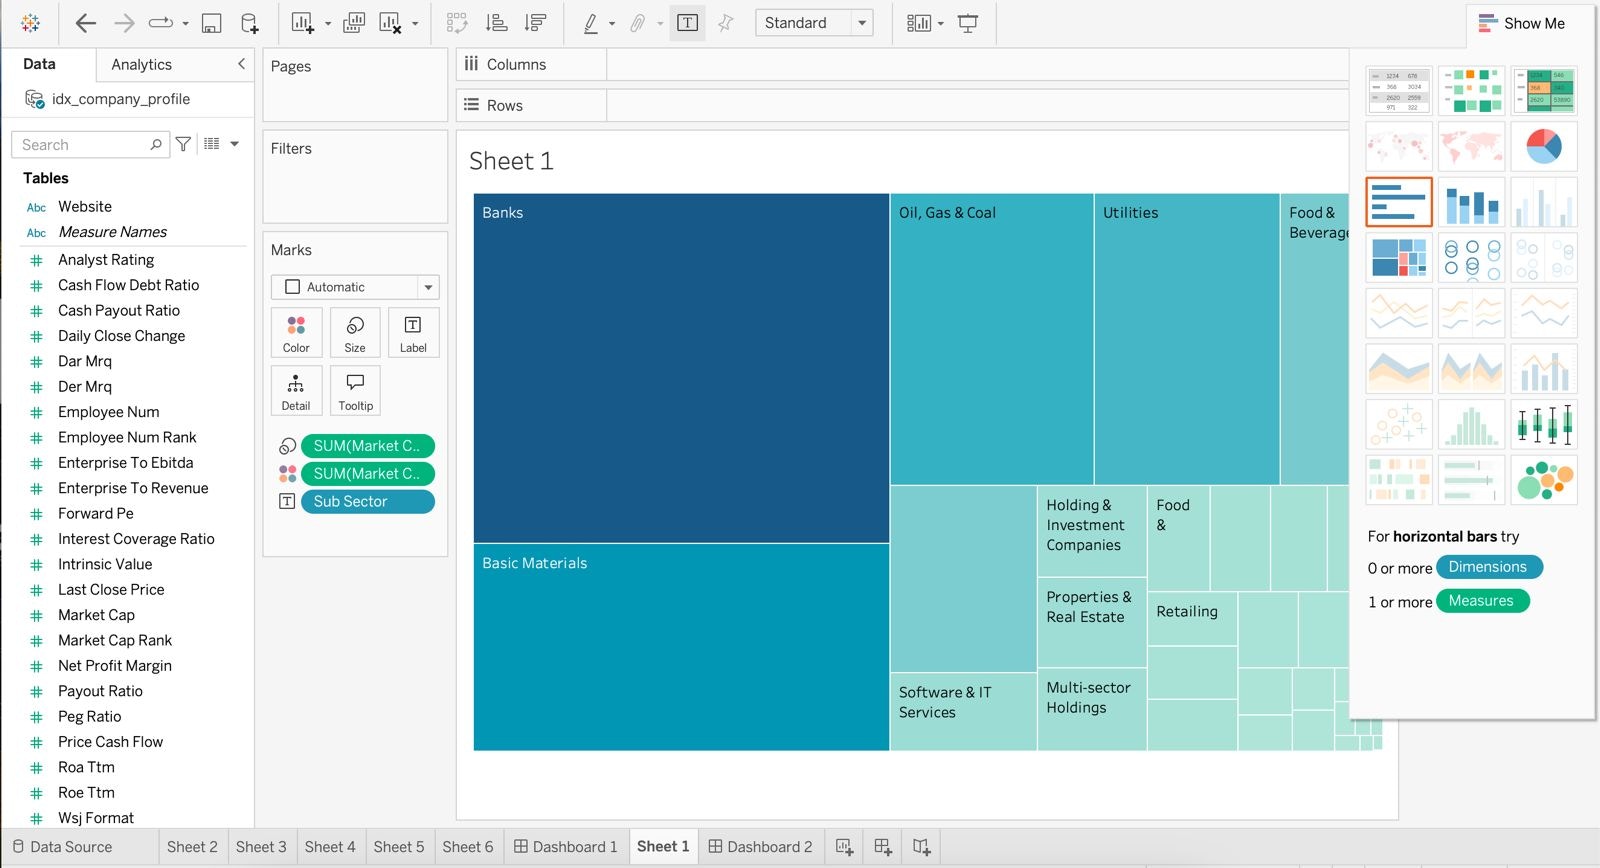
Create Visualization in Worksheet
Hands-On practice
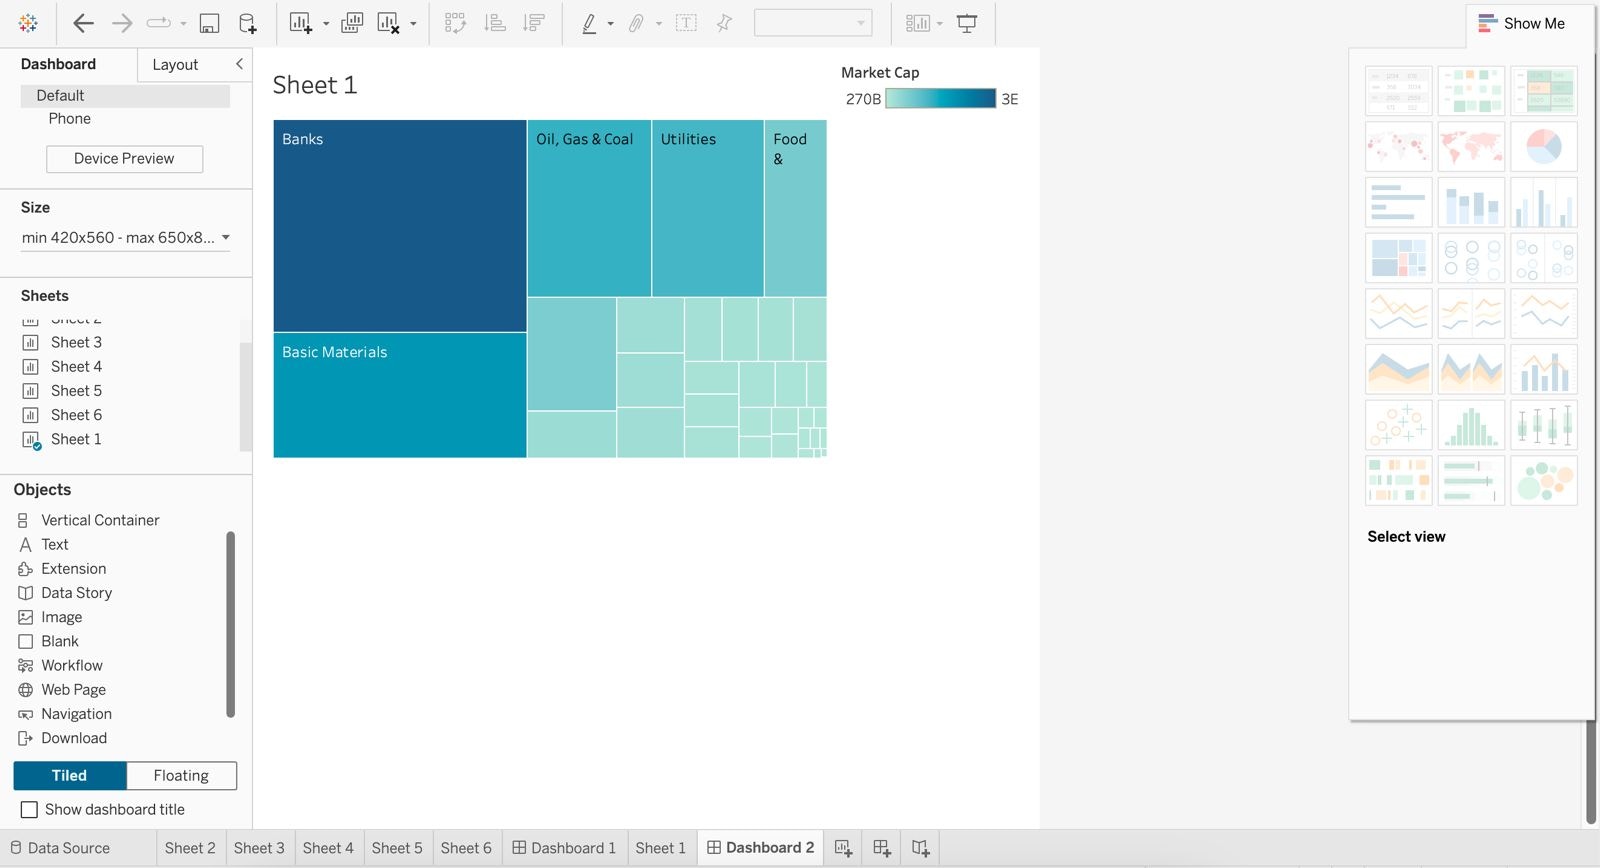
After seeing a mini tutorial on how creating a visualization and dashboard in Tableau, now we will directly create a dashboard using actual data. The dataset can be downloaded from here.Dashboard Example
Tableau Public Dashboard Example by Gerald Bryan