Welcome to the Coursebook program
Congratulations on taking your first step towards becoming a data professional!Pre-requisites
Estimated time: None to 30 minutes Before you get started, make sure you have the following installed on your machine with the right privileges. If your machine is issued by your company, you may have to ask your IT department to grant you the necessary permissions and firewall access.- Install Python 3.7 or higher
- Install Git
- Install a code editor (I recommend Visual Studio Code, or VSCode for short)
- Install Tableau Public
Tooling and Setup
Estimated time: 45 minutesClone the materials locally
Clone the materials locally
Throughout this learning path, you’ll be asked to write code and develop solutions
to the problems presented. To help you with this, your instructors have developed
a set of materials that you can clone and use on your local machine.
Set up your environment variables
Set up your environment variables
Throughout the course, you’ll be working with a variety of tools and services.
To ensure that your code runs correctly, you’ll need to set up environment variables
that contain sensitive information such as API keys and database credentials.Follow the instructions in the repository to set up your environment variables. At no
point should you ever commit your environment variables to the repository or
use them in your code directly.
Perform the exercises in setting up your Python environment
Perform the exercises in setting up your Python environment
Hop to the following section to perform the exercises in setting up your Python environment.Successful completion of this section will ensure that you have the necessary tools and libraries installed to work with Python,
and that is a good starting point for the rest of the course.
Python programming environment
To test that you have set up everything correctly, complete the following steps: Estimated time: 1 HourPull external data into Python
- Use a command prompt or your Terminal to launch your command line interface, then
pip install requeststo install the Requests library. - Type
pythonorpython3to launch the Python interpreter. - Run the following code snippet to pull external data into Python:
Troubleshooting
Troubleshooting
If the
requests library is installed correctly, this code should execute without errors, and response.status_code should return 200, which is the HTTP status code for a successful request.If the requests library is not installed, Python will raise an ImportError, indicating that the requests module is not found.Sample Output
Sample Output
To verify that you’ve performed the example correctly, the output should resemble the following:
Applications
Applications
Reading in data from external sources is a common task in data analysis and data science. By using the
requests library,
you can easily pull data from APIs, websites, and other online sources directly into Python for further analysis and processing. Did you know?
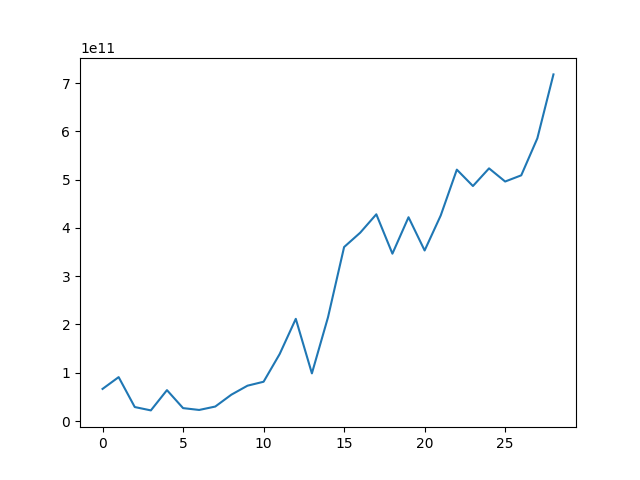
The data you just pulled in the total historical market capitalization of the IDX (Indonesian Stock Exchange) from 1995 to 2023.
In fact, it is used in this visualization on a financial intelligence app we’ve built:Use Pandas and Matplotlib
pandasis a powerful data manipulation library that allows you to work with structured data in Python.matplotlibis a plotting library that enables you to create visualizations from your data. We’ll be using these libraries extensively throughout the Python data analysis courses.
pip install pandas matplotlib in your terminal.Then, run the following code snippet to visualize the data you pulled in the previous step:Troubleshooting
Troubleshooting
-
If the
pandasandmatplotlibare installed correctly, this code should execute without errors, and it will use thematplotliblibrary to plot the market capitalization data. Callingplt.show()will display the plot in a new window. -
If
pandasormatplotlibis not installed, Python will raise an ImportError, indicating that the module is not found.
Sample Output
Sample Output