Introduction to Pandas
Pandas is a powerful and flexible Python library designed for data manipulation and analysis. It provides data structures and functions needed to work with structured data seamlessly. For financial bankers, Pandas offers a way to perform complex data analysis tasks efficiently, making it an invaluable tool for exploring and interpreting financial data. Pandas introduces two primary data structures that are central to data analysis:- Series:
- Description: A one-dimensional array-like object that can hold various data types (e.g., integers, strings, floats). It is similar to a column in a spreadsheet.
- Usage Example: A Series can represent stock prices over time.
- DataFrame:
- Description: A two-dimensional tabular data structure that can hold multiple data types (e.g., Series, lists, dictionaries). It is similar to a spreadsheet or SQL table.
- Usage Example: A DataFrame can represent a financial dataset with multiple columns (e.g., stock prices, trading volume, market capitalization).
Core Functions and Methods
Pandas provides a range of functions and methods to facilitate data analysis:-
Data Loading:
-
Read CSV: Import data from CSV files, which are commonly used in financial reporting.
-
Read Excel: Load data from Excel spreadsheets.
-
Read CSV: Import data from CSV files, which are commonly used in financial reporting.
-
Data Exploration:
-
View Data: Quickly view the first few rows of a DataFrame to understand its structure.
-
Summary Statistics: Get a quick summary of numerical data.
-
View Data: Quickly view the first few rows of a DataFrame to understand its structure.
-
Data Cleaning:
-
Handling Missing Values: Identify and handle missing data, which is crucial for accurate analysis.
-
Data Transformation: Modify data, such as converting data types or normalizing values.
-
Handling Missing Values: Identify and handle missing data, which is crucial for accurate analysis.
-
Data Analysis:
-
Filtering Data: Extract subsets of data based on conditions.
-
Grouping and Aggregation: Summarize data by grouping and calculating statistics.
-
Filtering Data: Extract subsets of data based on conditions.
-
Data Visualization:
-
Basic Plotting: Create simple plots directly from a DataFrame to visualize trends and patterns.
-
Basic Plotting: Create simple plots directly from a DataFrame to visualize trends and patterns.
Advantages of Using Pandas for Data Analysis
- Efficiency: Pandas can handle large datasets efficiently, which is essential for financial data analysis involving extensive historical records or real-time data streams.
- Flexibility: It supports various data formats and allows for complex manipulations, making it suitable for diverse financial data needs.
- Integration: Pandas integrates well with other Python libraries such as NumPy for numerical operations, Matplotlib for plotting, and Scikit-learn for machine learning, creating a robust data analysis ecosystem.
- Data Handling: It provides powerful tools for cleaning, transforming, and analyzing data, helping to ensure that your analysis is accurate and meaningful.
Using Pandas to measure the growth of IDX
The following is code you’ve seen (and hopefully executed) in the quickstart section. It reads a CSV file containing the historical market capitalization of the Indonesian Stock Exchange (IDX) and plots the market capitalization over time.
Sample Output
Sample Output
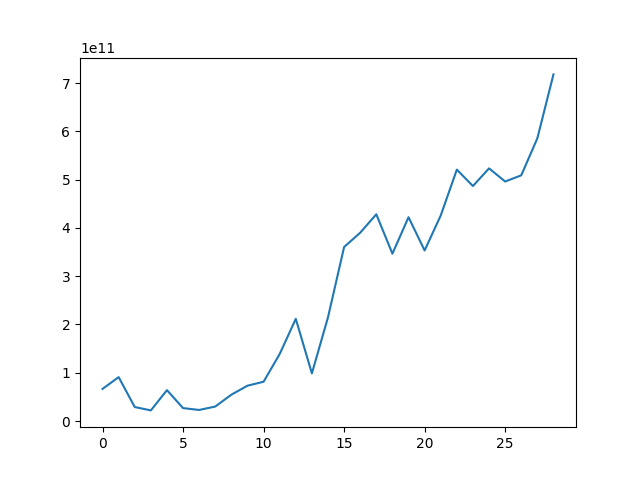
DataFrame object from a CSV file hosted remotely on GitHub.
We then plot the market capitalization data using the plot() method from Pandas,
and display the plot using plt.show() from Matplotlib. With pandas, we use the
square bracket notation bbri_nasabah[] to access columns in the DataFrame.
Indexing by Columns
df['market_cap']ordf.market_capselects the ‘market_cap’ column from the DataFrame.- In cases where the column name has spaces or special characters, you can use
df['column name']to access the column, but outside of those cases, you can usedf.column_nameas well.
- In cases where the column name has spaces or special characters, you can use
- To select multiple columns, you can pass a list of column names:
df[['currency', 'market_cap']].
Series object in return.
This is in constrast to selecting multiple columns, which returns another DataFrame with
the selected columns.
Indexing by Rows
To select data (“slicing”) by rows, you can use theloc and iloc accessors. To select
a single row, you can use the loc accessor with the row index label. Just like indexing
a single column, this returns a Series object.
iloc accessor to select rows by their integer index.
loc or iloc accessors, respectively.
Dropping Rows and Columns
To drop rows or columns from a DataFrame, you can use thedrop() method. The drop() method returns a new DataFrame with the specified rows or columns removed.
pandas DataFrames Attribute
What we’ve seen above are accessors to the DataFrame object. These are shortcuts
that help you slice out specific parts of the DataFrames.
In this section, we’ll shift our attention to the DataFrame object itself, starting
with the shape attribute. The shape attribute returns a tuple representing the
dimensions of the DataFrame, with the first element being the number of rows and
the second element being the number of columns.
columns, which returns the column labels of the DataFrame.
dtypes attribute returns the data types of each column in the DataFrame.
.values attribute returns the underlying NumPy array of the DataFrame.
This could be useful when you need to perform operations that are easier with NumPy
arrays, such as matrix multiplication or reshaping.
The .T attribute returns the transpose of the DataFrame, which swaps the rows and columns,
making it more readable when you have a large number of columns relative to rows.
.index, which provides the row labels of the
DataFrame. This index is like a list of row labels. In spreadsheets, this would be
the row numbers on the leftmost column. When we read in a CSV file, the index is
automatically generated as a RangeIndex object, unless we specify a column to be the index
through index_col parameter in pd.read_csv().
.drop() method, remember to now use the new index (row name)
in the drop() method.
.drop() operations together, but remember that the DataFrame is not modified in place
unless you reassign it to the same variable.
RangeIndex, you can use the reset_index() method.
Creating new columns
Being creative in data analysis can help unlock insights that are not immediately obvious. In the field of machine learning, this is sometimes referred to as feature engineering. For example, supposed we would like to train a machine learning model to predict the movement of the commodities market based on the market capitalization of the IDX. We could create a new column that represents the percentage change in market capitalization from the previous year.lambda functions a great deal when starting out
with Python and Pandas, but it’s good to know that they exist and can be used
to write concise code.
-
.apply(lambda x: ...): Applies a function to each element of the column- Lambda Function:
lambda x: 'positive' if x > 0 else 'negative'
- Lambda Function:
-
df['change_direction']: Creates a new column in the DataFrame namedchange_directionand assigns the results of the.apply()method to this column.
Checkpoint
Up to this part of the exercise, you should be able to:- Use
pandasto read in data from CSV files and Excel spreadsheets. - Access columns in a DataFrame using the square bracket notation.
- Use the
locandilocaccessors to select rows in a DataFrame. - Drop rows and columns from a DataFrame using the
drop()method. - Access DataFrame attributes like
shape,columns,dtypes,values,T, andindex. - Set and reset the index of a DataFrame.
- Create new columns in a DataFrame using existing columns.
Boolean Indexing
Boolean indexing is a powerful feature in Pandas that allows you to filter data based on conditions. You can use boolean arrays to filter rows based on specific criteria.& (and) and | (or).
idxmin() method to get the index of the minimum value.
Similarly, the idxmax() method can be used to get the index of the maximum value.
Helpful methods for DataFrames
Pandas provides a wide range of methods to help you explore and manipulate your data. Here are some commonly used methods:head(): Returns the firstnrows of the DataFrame.tail(): Returns the lastnrows of the DataFrame.describe(): Generates descriptive statistics that summarize the central tendency, dispersion, and shape of a dataset’s distribution.info(): Prints a concise summary of a DataFrame, including the index dtype and column dtypes, non-null values, and memory usage.unique(): Returns unique values in a column.value_counts(): Returns a Series containing counts of unique values.sort_values(): Sorts the DataFrame by the values along either axis.dropna(): Removes missing values from the DataFrame, either by dropping rows (axis=0) or columns (axis=1).
value_counts() and sort_values() on the DataFrame that
we’ve been working with.
Group By and Aggregation
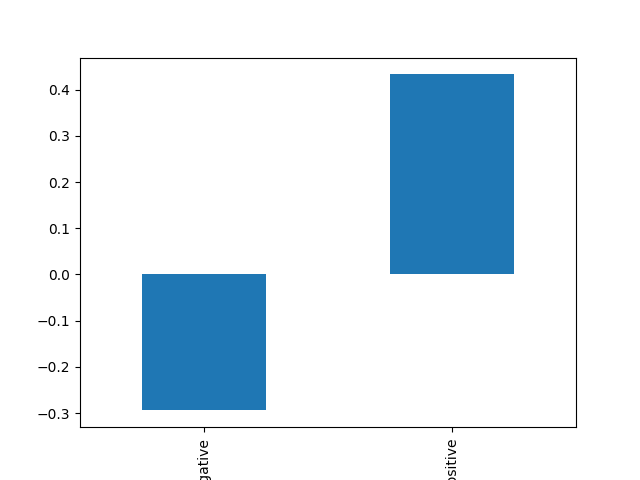
We’ve seen how to filter and sort data in a DataFrame. To summarize data, we can use thegroupby() method to group data based on one or more columns and then apply an aggregation function to each group.
A common aggregation function is mean(), which calculates the average value for each group.
matplotlib installed, you can visualize the results using a bar plot.
Sample Output
Sample Output
Summary
You have just learned a tremendous amount of information about Pandas, a powerful library for data manipulation and analysis in Python. You now know how to:- Load data from CSV files and Excel spreadsheets.
- Access columns and rows in a DataFrame using indexing and slicing.
- Drop rows and columns from a DataFrame.
- Use DataFrame attributes to get information about the DataFrame.
- Create new columns in a DataFrame.
- Filter data using boolean indexing.
- Use helpful methods for exploring and manipulating DataFrames, such as
value_counts()andsort_values(). - Group data and perform aggregation using
groupby().
Exercises
To solidify these learnings, you might be required to answer a few questions with a completely new dataset. The recommended time for the graded quiz is 45 minutes, but feel free to take as much time as you need.Google Classroom Graded Assignment
Head over to Google Classroom or the assigned learning management system to
complete the exercises and submit your work.
Lab: Data Manipulation and Analysis w/ Pandas
Using Pandas, perform a series of data manipulation and analysis tasks on Indonesia banking sector data provided by Sectors.
Graded Quiz
Graded Quiz
- Take the first 10 rows of the DataFrame, what is the median of the ‘market_cap_change_billion’ column?
- What is the year where IDX has increased the most in terms of market capitalization change as a percentage? (market_cap_change_%)
- In how many years did IDX experience a market cap change that is lower than -50%? Note that
the market capitalization change is calculated as the percentage change in market capitalization
from the previous year, and so your filter should be on the
market_cap_change_%column with (-0.5) used in the condition. - Taking only the 5 years between 2019 to 2023 (inclusive of both), at what rate did the market capitalization of IDX grow on average?
- Grouped by the ‘change_direction’ column, what is the median market capitalization change in billion USD for each group?
Author
This chapter is written by Samuel Chan, an analytics consultant at Supertype with over 11 years of experience of enterprise AI consulting across Singapore, China (DianDian, 600634:SH), Japan (TWP Dai Nippon, TYO:7912; gumi Inc, TWO:3903; SEGA, TYO:6460) and Indonesia (Emtek, Adaro Group of Companies, Central Bank of Indonesia, Bursa Efek Indonesia, BCA). He has long-term consulting experience with leading financial institutions in the region, and is the co-founder of Algoritma Data Science Education Center, Supertype, Sectors, and formerly HyperGrowth, a marketing automation and chatbot platform startup that he sold in 2016. Samuel is an avid open source contributor and guest lecturer at several universities across Indonesia and Singapore. He is currently ranked #1 in Indonesia (and top 2% worldwide) on Stack Overflow for R and Python topics (with 111 badges and contributions exceeding 2 million reach).Contributors
- Gerald Bryan, senior analytics consultant at Supertype